Second Quarter 2017 YDFS Market Review
The doom and gloom crowd will have to re-up their calls for an economic and market crash until next quarter. As is their MO, "early and often" calls of demise, until they ultimately get it right, will continue. Much to their dismay, the 2nd quarter of 2017 was a good one for markets worldwide.
The U.S. stock market has more than tripled in value during the runup that started in March 2009, and the most recent quarter somehow managed to accelerate the upward trend. We have just experienced the 3rd best first half, in terms of U.S. market returns, of the 2000s.
The Wilshire 5000 Total Market Index—the broadest measure of U.S. stocks—rose 2.95% for the quarter, finishing the first half of the year up 8.73%. The comparable Russell 3000 index is up 8.93% for the year so far.
Looking at large cap stocks, the Wilshire U.S. Large Cap index gained 3.08% in the second quarter, to stand at a 9.27% gain for the first two quarters. The Russell 1000 large-cap index finished the first half of the year with a similar 9.27% gain, while the widely-quoted S&P 500 index of large company stocks gained 2.41% for the quarter and is up 8.08% in the first half of 2017.
Meanwhile, the Russell Midcap Index gained 7.99% in the first two quarters of the year.
As measured by the Wilshire U.S. Small-Cap index, investors in smaller companies posted a relatively modest 1.65% gain over the second three months of the year, to stand at a 3.95% return for 2017 so far. The comparable Russell 2000 Small-Cap Index finished the first half of the year up 4.99%, while the technology-heavy Nasdaq Composite Index broke the 6,000 barrier in April, rose 4.18% for the quarter and is up 14.14% in the first half of the year.
International investments are finally delivering returns to our portfolios. The broad-based EAFE index of companies in developed foreign economies gained 5.03% in the recent quarter, and is now up 11.83% for the first half of calendar 2017. In aggregate, European stocks have gone up 14.49% so far this year, while EAFE’s Far East Index has gained 10.45%. Emerging market stocks of less developed countries, as represented by the EAFE EM index, rose 5.47% in the second quarter, giving these very small components of most investment portfolios a remarkable 17.22% gain for the year so far.
Looking over the other investment categories, real estate, as measured by the Wilshire U.S. REIT index, gained 1.78% gain during the year’s second quarter, posting a meager 1.82% rise for the year so far. The S&P GSCI index, which measures commodities returns, lost 7.25% for the quarter and is now down 11.94% for the year, in part due to a 20.43% drop in the S&P petroleum index. Gold prices are up 7.69% for the year, and silver has gained 3.28%.
In the bond markets, longer-term Treasury rates haven’t budged, despite what you might have heard about the Fed tightening efforts. Coupon rates on 10-year Treasury bond rates have dropped a bit to stand at 2.30% a year, while 30-year government bond yields have dropped in the last three months from 3.01% to 2.83%.
By any measure, this represents a strong first half of the year, driven (as you can see by the graph) by the S&P 500 tech sector, biotech firms and information technology companies generally. What is interesting is that investors appear to be flooding into these business categories because they are the ones most likely to grow their sales even if the economic environment were to turn sour—which suggests a growing bedrock of pessimism about future economic growth among seasoned investors.

Is that justified? Economic growth was admittedly meager in the first quarter—U.S. GDP (gross domestic product) grew just 1.4% from the beginning of January to the end of March, a figure that was actually revised upwards from initial estimates of 0.7%. That represents a slowdown from the 2.1% growth in the fourth quarter of last year, when the country was being managed by a different Presidential Administration. It might be helpful to note that the budget proposals floating around Washington, D.C. make the optimistic assumption of an economic growth rate of 3.0%. If the economy fails to achieve that rate, then watch out for a significant rise in the federal deficit. I suspect economic growth will come in closer to 2.4%
There is room for hope. The Atlanta Federal Reserve recently forecasted that the U.S. economy will grow at a 2.9% rate for the year’s third quarter. We won’t have definitive evidence of that until sometime in October, but our fingers are crossed. More good news: the unemployment rate is at a near-record low of 4.7%, and wages grew at a 2.9% rate in December, the best increase since 2009. The underemployment rate, which combines the unemployment rate with part-time workers who would like to work full-time, has fallen to 9.2%--the lowest rate since 2008.
Meanwhile, the energy sector, which was a big winner last year, has dragged down returns in 2017. This proves once again the value of diversification; just when you start to question the value of holding a certain investment, or wonder why the entire portfolio isn’t crowded into one that is outperforming, the tide turns and the rabbit becomes the hare and the hare becomes the rabbit. If only this were predictable. I like to say that the only problem with consistently accurate market timing is getting the timing right :-).
There are many uncertainties to watch in the days ahead. The U.S. Congress is still debating a health care package, and has promised to revise our corporate and individual income tax code later this year. There’s an infrastructure package somewhere on the horizon, and perhaps a round or two of tariffs on imported goods. Inflation often follows when the Fed raises rates, but we don’t know if or when the Fed will do that, or by how much.
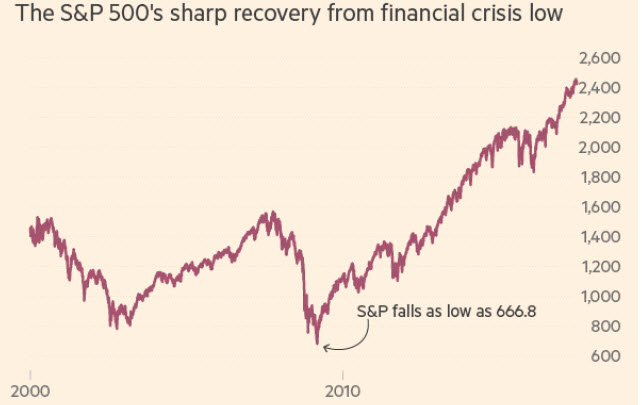
Meanwhile, the current bull market is aging, and as you can see from the accompanying chart, the runup has lasted for longer than anybody would have expected when we came out of the gloomy period after the 2008 crisis. However, bull markets don't die of old age; they die of overexuberance, something we don't currently have in the current market environment, as many are still quite pessimistic on the market and our economic prospects, and are therefore still on the sidelines or woefully underinvested. What I can say is that stock valuations are a bit stretched by some traditional measures, but I could have said that for the last 2-3 years. Market (over)valuation is not a very good market timing tool.
Nonetheless, we are moving ever closer to a period when stock prices will inevitably go down. That day cannot be predicted in advance, but it is always good to spend a moment and ponder how much of a downturn you would be comfortable with when markets finally turn against us. If your answer is less than 20%, or close to that figure (which is the definition of a bear market), this might be a good time to revisit your stock and bond allocations. It never hurts to take some profits off the table during the good times, to have some cash to re-deploy after a protracted downturn. On the other hand, if you’re not fearful of a downturn, then the next bear market will be a terrific buying opportunity for all of us.
If you would like to review your current investment portfolio or discuss any other financial planning matters, please don’t hesitate to contact us or visit our website at http://www.ydfs.com. We are a fee-only fiduciary financial planning firm that always puts your interests first. If you are not a client yet, an initial consultation is complimentary and there is never any pressure or hidden sales pitch. We start with a specific assessment of your personal situation. There is no rush and no cookie-cutter approach. Each client is different, and so are your financial plan and investment objectives.
Sources:
Wilshire index data: http://www.wilshire.com/Indexes/calculator/
Russell index data: http://www.ftse.com/products/indices/russell-us
S&P index data: http://www.standardandpoors.com/indices/sp-500/en/us/?indexId=spusa-500-usduf--p-us-l--
Nasdaq index data:
http://quotes.morningstar.com/indexquote/quote.html?t=COMP
http://www.nasdaq.com/markets/indices/nasdaq-total-returns.aspx
International indices: https://www.msci.com/end-of-day-data-search
Commodities index data: http://us.spindices.com/index-family/commodities/sp-gsci
Treasury market rates: http://www.bloomberg.com/markets/rates-bonds/government-bonds/us/
Bond rates:
http://www.bloomberg.com/markets/rates-bonds/corporate-bonds/
General:
https://www.ft.com/content/cb5b1156-5d9e-11e7-b553-e2df1b0c3220
https://wdef.com/2017/06/29/economy-grew-1-4-in-first-quarter-higher-than-previous-estimates/
http://money.cnn.com/2017/01/06/news/economy/december-jobs-report-2016/index.html?iid=EL
The MoneyGeek thanks guest writer Bob Veres for his contribution to this post
 YDream Financial Services, Inc