"Curve" Your Enthusiasm?
 Tuesday, May 29, 2018 at 7:10PM
 When I was starting out in the financial planning business, I used to listen to smart people who spewed out catchy phrases like "inverted yield curve", "risk-free rate", and "henway". Back then, I didn't really understand much of the lingo, so I was fortunate that all this "gibberish" was only a web-search away. In my discussions these days, I try and avoid jargon as much as possible and strive to distill financial concepts into their simplest components. Today is one such attempt to explain the inverted yield curve and its effect on the economy and markets.
This so-called "best" indicator of a future recession, the inverted yield curve, is not perfect and doesn’t provide an exact time or date. But economists have found that an inverted yield curve can be a warning sign of an economic downturn to come.
Again, an inverted what??? The yield curve is a line graph of the yield (i.e., interest rate) of treasury bills (bonds) from the very short term—one month, three months, six months, 1, 2, 3, 5, 7, 10 and all the way out to 30 years. A normal curve is sloped upward—for obvious reasons: the longer the maturity of the bond, the more the borrower should have to pay to compensate you for the risks of inflation and future interest rate movements. The 3-month treasury bill should pay at least incrementally more than the 1-month treasury bill, and on up the maturity range.
Deviations from this obvious hierarchy, called "inversions", are rare—as it turns out, just about as rare as recessions. This would be akin to walking into a bank and accepting a lower interest rate on a 2-year certificate of deposit (CD) than on a 1-year CD. Few would ever do that (especially since the penalties for early withdrawal are a bit steep).
Since 1955, long-term bonds yielded less than short-term ones before every single U.S. recession. Nobody knows exactly why a spate of market illogic should be followed by economic pain; there are theories, but the cause/effect is uncertain.
Unfortunately, the inversions in the past have occurred anywhere from 6 months to 24 months before the actual recession, so this is not exactly a precise timing mechanism. But perhaps we should consider the next yield inversion as a time to buckle our seat belts on the investment roller coaster.

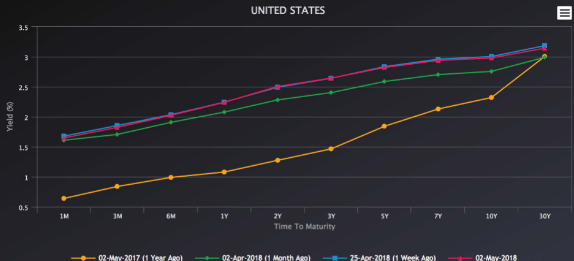
So where are we now? The above chart shows the current yield curve (red) compared with a week ago (blue), a month ago (green) and a year ago (orange). As you can see, the curve has flattened in the past 12 months, not to the point of inversion, but certainly a narrower spread (i.e., difference between yields). If you want to watch to see if there is further flattening, here’s one website that tracks the curve in real-time: https://www.bondsupermart.com/main/market-info/yield-curves-chart.
Now, when someone utters the phrase "inverted yield curve", you can nod in understanding. And if they ask what's the risk-free rate, you can tell them it's the current yield on the 10-year treasury note.
Finally, if anyone asks "what's a henway", you tell them "oh, a hen weighs about three or four pounds".
If you would like to review your current investment portfolio or discuss any other financial planning matters, please don’t hesitate to contact us or visit our website at http://www.ydfs.com. We are a fee-only fiduciary financial planning firm that always puts your interests first. If you are not a client yet, an initial consultation is complimentary and there is never any pressure or hidden sales pitch. We start with a specific assessment of your personal situation. There is no rush and no cookie-cutter approach. Each client is different, and so is your financial plan and investment objectives.
Sources:
https://www.bondsupermart.com/main/market-info/yield-curves-chart
The MoneyGeek thanks guest writer Bob Veres for his contribution to this post
Reader Comments