I often remind my clients and prospects that judging market performance for periods shorter than a few years, isn’t very helpful. Market returns are simply random over relatively brief periods. However, over longer periods, such as five years, stocks are almost always profitable and offer very good performance. The S&P 500 has finished higher in 91% of the rolling-five-year periods over the last 50 years.
Nonetheless, it's helpful to check back and see how well the markets performed over the past quarter While the U.S. equity markets suffered a small setback in the first quarter of 2018, the second quarter brought us back into positive territory.
The Wilshire 5000 Total Market Index—the broadest measure of U.S. stocks—finished the quarter up 3.83%, and is now in positive territory for the first half of the year, at +3.04%. The comparable Russell 3000 index is up 3.22% so far this year.
Large cap stocks more than recovered their earlier losses. The Wilshire U.S. Large Cap index gained 3.41% over the past three months, to finish up 2.62% for the first half of the year, while the Russell 1000 large-cap index stands at a 2.85% gain at the year’s halfway point. The widely-quoted S&P 500 index of large company stocks gained 2.93% in value during the year’s second quarter, rallying to a 1.67% gain so far in 2018.
Meanwhile, the Russell Midcap Index is up 2.35% in the first six months of the year.
As measured by the Wilshire U.S. Small-Cap index, investors in smaller companies posted a 7.87% gain over the second three months of the year, and now stand up 7.08% at the half-year mark. The comparable Russell 2000 Small-Cap Index is up 7.66% for the year. The technology-heavy Nasdaq Composite Index finished the quarter with a gain of 6.31%, and is now up 8.79% at the halfway point of 2018. Much of the over-performance of the NASDAQ can be attributed to a handful of stocks such as Amazon, Facebook, Google and Neflix.
International stocks are not faring quite so well. The broad-based MSCI EAFE index of companies in developed foreign economies lost 2.34% in the recent quarter, and is now down 4.49% for the year. In aggregate, European stocks were down 2.74% over the last three months, posting an overall loss of 5.23% for the year, while MSCI’s EAFE’s Far East Index lost 3.24% in the second quarter, down 3.33% so far in 2018. Emerging market stocks of less developed countries, as represented by the MSCI EAFE EM index, went into negative territory for the quarter, down 8.66%, for a loss of 7.68% for the year.
Looking over the other investment categories, real estate, as measured by the Wilshire U.S. REIT index, gained 9.73% during the year’s second quarter, and is just eking out a 1.52% gain for the year. The S&P GSCI index, which measures commodities returns, gained 8.00% in the second quarter, up 10.36% for the year, mainly due to the rising price of oil.
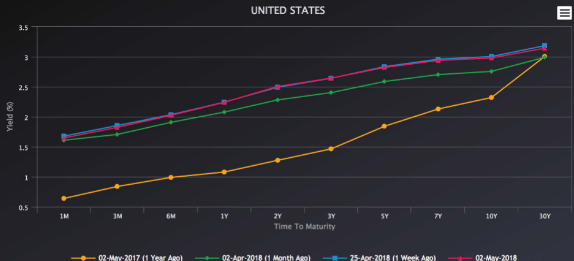
In the bond markets, coupon rates on 10-year Treasury bonds have continued an incremental rise to 2.86%, while 30-year government bond yields have risen slightly to 2.99%. Five-year municipal bonds are yielding, on average, 2.00% a year, while 30-year munis are yielding 3.00% on average. Simply put, at present, investing in bonds with a term greater than 10 years is not rewarding you for the many years of interest rate risk you're taking. That may change.
So what’s going on? There appear to be several forces fighting for control over the investment markets. The current bull market started in March of 2009, and seemed to be running out of steam in the first quarter, before a sugar high—the stimulus provided by the recent tax bill—kicked in for companies that have traditionally experienced higher tax rates. This pushed a tired bull market forward for another quarter, and could do the same for the remainder of the year. A fiscal stimulus in the ninth year of an economic expansion is almost unheard of, but it is clearly having a positive effect: economic activity was up nearly 5% in the second quarter, unemployment has continued a downward trend that really started at the beginning of the bull market, and corporate earnings—with the lower corporate taxes factored in—are projected to increase roughly 25% over last year.
The other contestants for control of the economy seem destined to lose this year and possibly start winning in 2019. The Federal Reserve Board has raised short-term interest rates once again, and has announced plans to continue in September, December, next March and next June. Bonds' share of investors' dollars at some point will overtake stocks as government 10 year bond yields reach 4% or more, making it difficult for stocks to levitate at current levels.
Meanwhile, the labor markets are so tight that there are more jobs available than workers to fill them. Won’t this eventually force companies to share their profits in the form of higher salaries? And there are potential problems with the escalating trade war that America has picked with its trading partners that will almost certainly not have a positive impact in the long term.
Bigger picture, the flattening yield curve—where longer-term bonds are closer to yielding what shorter-term instruments are paying—is never regarded as a good sign for an economy’s near-term future. It’s worth noting that the financial sector—that is, lending institutions—was one of the economic sectors to experience a loss. Banks borrow short and lend long, and there isn’t much profit in that activity when the rates are about equal.
Beyond that, in a good year, corporate earnings would grow around 5%, so one could argue that the economy is now experiencing five years of earnings growth. Add these factors to the doddering age of the current bull market, and you have to wonder how long the party can continue. Nobody knows what tomorrow will bring, but everybody knows that bull (up-trending) markets don’t last forever. This may be a good time to mentally and financially prepare for an end to the long bull run, and to hope it ends gracefully. For our clients, we remain cautious bulls and are keeping our hedges in place. The higher volatility we've experienced so far this year shows no sign of waning, and the low-volume summer trading season is the ideal time for market shenanigans to show up.
If you would like to review your current investment portfolio or discuss any other financial planning matters, please don’t hesitate to contact us or visit our website at http://www.ydfs.com. We are a fee-only fiduciary financial planning firm that always puts your interests first. If you are not a client yet, an initial consultation is complimentary and there is never any pressure or hidden sales pitch. We start with a specific assessment of your personal situation. There is no rush and no cookie-cutter approach. Each client is different, and so is your financial plan and investment objectives.
Sources:
Wilshire index data: http://www.wilshire.com/Indexes/calculator/
Russell index data: http://www.ftse.com/products/indices/russell-us
S&P index data: http://www.standardandpoors.com/indices/sp-500/en/us/?indexId=spusa-500-usduf--p-us-l--
Nasdaq index data: http://quotes.morningstar.com/indexquote/quote.html?t=COMP
http://www.nasdaq.com/markets/indices/nasdaq-total-returns.aspx
International indices: https://www.msci.com/end-of-day-data-search
Commodities index data: http://us.spindices.com/index-family/commodities/sp-gsci
Treasury market rates: http://www.bloomberg.com/markets/rates-bonds/government-bonds/us/
Bond rates: http://www.bloomberg.com/markets/rates-bonds/corporate-bonds/
General: https://www.marketwatch.com/story/stocks-see-broad-gains-in-the-second-quarter-but-not-without-turbulence-2018-06-29
https://www.cnbc.com/2018/06/08/gdp-for-second-quarter-on-track-to-double-2018-full-year-pace-of-2017.html
https://finance.yahoo.com/news/jobs-report-4th-july-need-know-week-ahead-191630507.html
The MoneyGeek thanks guest writer Bob Veres for his contribution to this post
 YDream Financial Services, Inc