News
Sunday
Aug142016

Managing and Paying Off Student Loans

A couple of weeks ago, I posted an article here entitled "A College Education Still Pays" despite the growing student loan burden. If you already owe money on student loans, this article follows up and suggests ways to manage and pay off your student loans.

Actively managing your debt is an important step, and your student debt may be one of the biggest financial obligations you have. There are many strategies that could help you manage student loans efficiently. Here is a checklist:

  • Choose a federal loan repayment plan that fits your circumstances: 
    • The Graduated Repayment Plan starts with a reduced payment that is fixed for a set period, and then is increased on a predetermined schedule. Compared to the standard plan, a borrower is likely to end up paying more in interest over the life of the loan.
    • The Standard Repayment Plan requires a fixed payment of at least $50 per month and is offered for terms up to 10 years. Borrowers are likely to pay less interest for this repayment plan than for others.
    • The Extended Repayment Plan allows loans to be repaid over a period of up to 25 years. Payments may be fixed or graduated. In both cases, payments will be lower than the comparable 10-year programs, but total costs could be higher. This program is complex and has specific eligibility requirements. See the Extended Repayment Plan page on the U.S. Department of Education website for details.
    • The Income-Based Repayment Plan (IBR), the Pay as You Earn Repayment Plan, the Income-Contingent Repayment Plan (ICR) and the Income-Sensitive Repayment Plan offer different combinations of payment deferral and debt forgiveness based on your income and other factors. You may be asked to document financial hardship and meet other eligibility requirements. See the U.S. Department of Education's pages on income-driven repayment plans and income-sensitive repayment plans for more information.
  • Take an inventory of your debt. How much do you owe on bank and store credit cards? On your home mortgage and home equity credit lines? On car loans? Any other loans? Consider paying extra each month to reduce the loans with the highest interest rates first, followed by those with the largest balances.
  • Free up resources by cutting costs. Consider eating out less, reducing snacks on the go, and carpooling or using mass transit instead of driving to work. You may also be able to cut your housing costs, put off or take less costly vacations and reduce clothing and other discretionary purchases.
  • Think about enhancing your income. A second job? A part-time business opportunity? Selling unused household items on eBay? Diversifying your income is just as important as diversifying your investments.
  • Consider jobs that offer opportunities for subsidies or debt forgiveness. 
  • Sign up for automatic loan payments. Many loans offer discounted interest rates for setting up automatic electronic payments on a predetermined schedule. A reduction of 0.25% per year may look small, but over the life of a 20-year loan, it can reduce your total interest cost by hundreds or even thousands of dollars.
  • A last resort is seeking loan deferment or forbearance. Students facing significant financial hardship may be able to put off loan interest or principal payments. To see whether you might qualify, look to the U.S. Department of Education's information on Deferment and Forbearance.

If you would like to review your current investment portfolio or discuss any other financial planning matters or student loan options, please don’t hesitate to contact us or visit our website at http://www.ydfs.com. We are a fee-only fiduciary financial planning firm that always puts your interests first.  If you are not a client yet, an initial consultation is complimentary and there is never any pressure or hidden sales pitch. We start with a specific assessment of your personal situation. There is no rush and no cookie-cutter approach. Each client is different, and so is your financial plan and investment objectives.


Saturday
Aug062016

Did You Exit After Brexit?

The pundits had it all wrong with the Brexit vote (I too was wrong on the British vote to exit from the European Union).

With the benefit of hindsight, we can see that it would have been a bad idea to sell your stock holdings after the Brexit vote; you would have locked in a 5% to 10% loss in a market that has trended upward to new record highs.  The same is true of the aftermath of the World Court decision that slapped China in the face by declaring that man-made islands don’t transform an ocean into territorial waters, the attempted coup in Turkey, or, really, any other alarming headline which doesn’t materially affect a company’s ability to run its operations or earn a profit.

But the bigger issue is that, even if you knew the outcome of the vote, you still wouldn't have known how markets were going to react.  How would you know whether quick-twitch traders would buy or sell the event?  After the Brexit vote, it took a weekend for investors and traders to realize that this was Britain’s problem, not theirs.  Realistically, it could have taken a month, or even a year to play out.

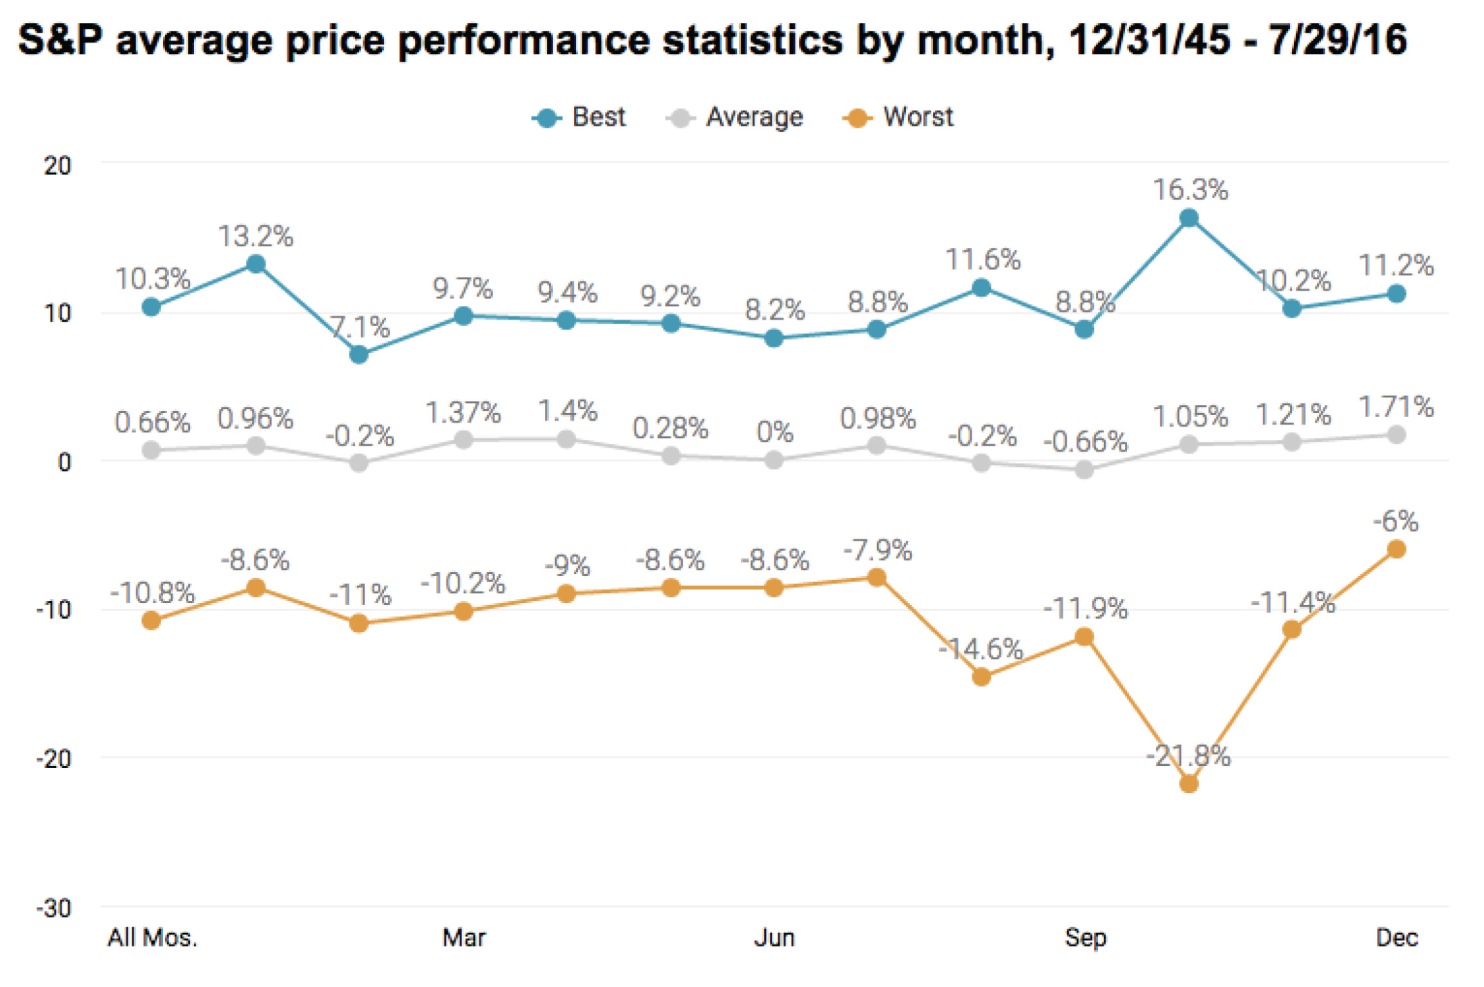
The same is true for the time period that we’re heading into now.  As you can see from the accompanying chart, the average return for various months of the year has been pretty much the same across the spectrum.  But August, September and October have seen bigger highs and (most alarmingly) also deeper lows, on average, than other months.  This additional volatility seems to be random, and is, once again, impossible to time.  People who decide to side-step the late summer and early fall would miss out on average yearly gains for September and October of 1.05% and 1.21%.  (Skipping August would have saved you modest losses of less than 1%, on average, but one suspects that this is a statistical anomaly.) The month of August in election years, even during the bear market of 2008, tends to have a positive bias; will this year be one of them?

CA - 2016-8-3 - Riding the coaster

Finally, biggest picture of all, the current bull market, which started March 9, 2009, has now become the second-longest bull market on record, beating the June 1949 to August 1956 rally.  It is second only to the December 1987 to March 2000 advance.  In terms of percentage change, we are experiencing the fourth strongest bull market on record.

Doesn’t that mean it’s time to take our chips off the table?  If we knew how to consistently time the market, if we could be sure that the market run won’t continue to run up for another few years, then the answer would be yes.  But with the economy continuing to churn out positive gross domestic product (GDP--the measure of our output of goods and services), with inflation low and unemployment continuing to fall, and central bankers supplying liquidity and stimulus to the markets, it’s hard to see what would cause U.S. stocks to be less valuable in the near future than they are today.

Meanwhile, once again, even if we did exit, how would we know when to get back in?  Investors who bailed during the 2008 downturn missed much of the surprise upturn that began this current bull run.  Those who hung on more than made up for their losses, even though it seemed like every year would be the bull market’s last. One thing that I've learned from doing this for so long, is that moves in the market (in both directions) usually go on far longer than most people can imagine.

There isn't a day where some market "expert" or pundit comes out and says he likes nothing in this market and to sell everything? ... Really?? Sell everything?! It angers me how reckless these statements are. Giving blanket advice to people is irresponsible. You don’t know the person’s goals, age, risk tolerance, time-frame, etc. But fearful headlines will always attract eyeballs, and most of these pundits have something to sell you. Don't buy it. Maybe you should sell some things, but always do your own due diligence and always keep in mind your long-term goals.

It’s nearly certain that there will be a lot of scary headlines between now and the end of the year, and it’s quite likely that the investment roller coaster is about to get bumpy.  All of us wish that we had a working crystal ball to help us navigate through uncertainty, but all we have is the historical record, which says that after the next downturn, the market will eventually experience a new high (yes, this will happen regardless of who becomes our next president).  We want to be there to celebrate it.

If you would like to review your current investment portfolio or discuss any other financial planning matters, please don’t hesitate to contact us or visit our website at http://www.ydfs.com. We are a fee-only fiduciary financial planning firm that always puts your interests first.  If you are not a client yet, an initial consultation is complimentary and there is never any pressure or hidden sales pitch. We start with a specific assessment of your personal situation. There is no rush and no cookie-cutter approach. Each client is different, and so is your financial plan and investment objectives.

Sources: 

https://www.washingtonpost.com/business/get-there/given-the-brexit-brouhaha-how-did-your-investments-hold-up/2016/07/22/a7bc1198-4d03-11e6-a7d8-13d06b37f256_story.html

http://www.investmentnews.com/article/20160801/FREE/160809992/if-history-is-a-guide-market-volatility-is-about-to-spike

http://www.cnbc.com/2016/07/13/merrill-second-longest-bull-market-ever-has-further-to-run.html

The MoneyGeek thanks guest writer Bob Veres for his contribution to this post

Sunday
Jul312016

A College Education Still Pays

These days, it's hard not to hear about the student loan mess and how it's the next financial crisis that's currently brewing (some are already calling it a bubble).  Students and parents write stories of how they were lured into borrowing far more money for college than they could ever pay back, even after throwing three or four years worth of salary at it. That is, if they could even find a job after graduation. Despite a student debt level that continues to grow, a college education is still one of the most worthwhile investments a high school graduate can make.

According to the Student Loan Marketing Association (more commonly known as Sallie Mae Bank), the average tuition, room and board at a private college comes to $43,921.  Public tuition for in-state students at state colleges amounted to $19,548, with out-of-state students paying an average of $34,031.

How are parents and students finding the cash to afford this expense?

Sallie Mae breaks it down as follows: 34% from scholarships and grants that don’t have to be paid back, coming from the college itself or the state or federal government, often based on need and academic performance.

Parents typically pay 29% of the total bill (an average of $7,000) out of savings or income, and other family members (think: grandparents) are paying another 5%.

The students themselves are paying for 12% of the cost, on average.

The rest, roughly 20% of the total, is made up of loans.  The federal government’s low-interest loan program offers up to $5,500 a year for freshmen, $6,500 during the sophomore year, and $7,500 for the junior and senior years.  If that doesn’t cover the remaining cost, then students and parents will borrow from private lenders.  The average breakdown is students borrowing 13% of their total tuition costs and parents borrowing the other 7%.

Is the cost worth it?  The Federal Reserve Bank of New York recently published a report on the labor market for college graduates.  The conclusion, in graphical format, is that younger workers have experienced much higher unemployment rates than their college graduate peers—the figures currently are 9.5% unemployment for all young workers, vs. just 4.2% for recent college graduates.  Overall, the unemployment rate for people who have graduated with a 4-year degree is 2.6%, and even during the height of the Great Recession, it never went over 5%.

And income is higher as well.  The average worker with a bachelor’s degree earns $43,000, vs. $25,000 for people with a high school diploma only.  The highest average incomes are reported for people with pharmacy degrees ($110,000 mid-career average), computer engineering ($100,000), electrical engineering ($95,000), chemical engineering ($94,000), mechanical engineering ($91,000) and aerospace engineering ($90,000).

Lowest average mid-career incomes: social services ($40,000), early childhood education ($40,000), elementary education ($42,000), special education ($43,000) and general education ($44,000).

Among the lowest unemployment rates: miscellaneous education (1.0%), agriculture (1.8%), construction services (1.8%) and nursing (2.0%).

Yes, there are some themes here, and of course people in every career can fall above or below these averages.  Nor does everybody who graduates with a particular degree end up in a career that tracks that degree.  (Of particular note: the list does not include a financial planning or investment advisory degree.)  The point is that despite the cost, a college degree does seem to provide significantly better odds of getting a job, and getting paid more for the job you do get.

I plan to expand on some of the finer aspects and stories about student loan debt in an upcoming article-stay tuned.


Sources:

http://money.cnn.com/2016/06/29/pf/college/how-to-pay-for-college/index.html?iid=SF_LN

https://www.newyorkfed.org/research/college-labor-market/college-labor-market_unemployment.html

The MoneyGeek thanks guest writer Bob Veres for his contribution to this post

Wednesday
Jul132016

Learn to Embrace New Highs

It's been an interesting start of the week for those of us watching the stock markets. In case you hadn’t noticed, the S&P 500 index reached record territory on Monday, and the NASDAQ briefly crossed over the 5,000 level before settling back with a more modest gain.  At 2,137.6, the S&P 500 finished above the previous high of 2,130.82, set on May 21, 2015.

We’ve waited more than a year for the markets to get back to where they were before the downturn this January, before Brexit, and before a lot of uncertainties in the last 12 months.  The market top itself is an uncertainty; after all, many investors regard market tops warily.  When stocks are more expensive than they've ever been (or so goes the thinking) it may be time to sell and take your profits.  However, if you followed this logic and sold every time the market hit a new high, you’d probably have been sitting on the sidelines during most of the long ride from the S&P at 13.55 in June 1949, which was the bull market high after the index started at 10.  New highs are a normal part of the market, and it is just as likely that tomorrow will set a new one as not.  In fact, overall, the market spends roughly 12% of its life at all-time highs.

We all know that the next bear market will start with an all-time high, but we can never know which one in advance.  That's why in this business we say that there's nothing better than a new high, except the one that marks "the top".  But new market highs do not necessarily become market tops.  Let’s see if we can all celebrate this milestone without the usual dose of fear that often comes with new records.

Sources:

http://www.forbes.com/sites/shreyaagarwal/2016/07/11/sp-500-closes-at-record-high/?utm_source=yahoo&utm_medium=partner&utm_campaign=yahootix&partner=yahootix#7f74bf29721d

http://www.marketwatch.com/story/us-stock-futures-climb-with-sp-near-record-high-2016-07-11?siteid=yhoof2

http://www.usatoday.com/story/money/columnist/waggoner/2014/06/19/new-highs-dont-mean-you-have-to-sell/10921973/

The MoneyGeek thanks guest writer Bob Veres for his contribution to this post

Monday
Jul042016

Second Quarter 2016 YDFS Market Review

The official start of summer was only a few days ago, but the market already feels like it's taken us on a wild roller coaster ride this year. It certainly makes us feel like we’re in a bear (sideways to down) market, what with the surprising “Brexit” vote in the UK, the dismal first few weeks of the year and increased volatility across the board.  So it may come as a surprise that the second quarter of 2016 eked out small positive returns for many of the U.S. market indices, and most of them are showing positive (though hardly exciting) gains over the first half of the year.

The Wilshire 5000 Total Market Index--the broadest measure of U.S. stocks and bonds—was up 2.84% for the quarter, and is now up 3.69% for the first half of the year.  The comparable Russell 3000 index gained 1.52% for the quarter and is up 2.20% so far this year.

The Wilshire U.S. Large Cap index gained 2.65% in the second quarter of 2016, putting it at a positive 3.94% since the beginning of January.  The Russell 1000 large-cap index provided a 1.44% return over the past quarter, with a gain of 2.34% so far this year, while the widely-quoted S&P 500 index of large company stocks posted a gain of 1.90% in the second quarter, and is up 2.69% for the first half of 2016.

The Wilshire U.S. Mid-Cap index gained 4.33% for the quarter, and is sitting on a positive gain of 6.67% for the year.  The Russell Midcap Index is up 1.54% for the quarter, and is sitting on a positive gain of 3.82% for the year.

Small company stocks, as measured by the Wilshire U.S. Small-Cap index, gave investors a 4.09% return during the second quarter, up 4.98% so far this year.  The comparable Russell 2000 Small-Cap Index gained 1.96%, erasing gains in the first quarter and posting a 0.41% gain so far this year, while the technology-heavy Nasdaq Composite Index lost 0.56% for the quarter and is down 3.29% for the first half of 2016.

When you look at the global markets, you realize that the U.S. has been a haven of stability in a very messy world.  The broad-based EAFE index of companies in developed foreign economies lost 2.64% in dollar terms in the first quarter of the year, and is now down 6.28% for the first half of the year.  In aggregate, European Union stocks lost 7.60% in the first half of 2016.  Emerging markets stocks of less developed countries, as represented by the EAFE EM index, lost 0.32% for the quarter, but are sitting on gains of 5.03% for the year so far.

Looking over the other investment categories, real estate investments, as measured by the Wilshire U.S. REIT index, was up 5.60% for the second quarter, with a gain of 11.09% for the year.  Commodities, as measured by the S&P GSCI index, gained 12.67% of their value in the second quarter, giving the index a 9.86% gain for the year so far.  The biggest mover, unsurprisingly, is Brent Crude Oil, which has risen more than 15% in price over the quarter.

Meanwhile, interest rates have stayed low, once again confounding prognosticators who have been expecting significant rate rises for more than half a decade now.  The Bloomberg U.S. Corporate Bond Index is yielding 2.88%, while the Bloomberg U.S. Treasury Bond Index is yielding 1.11%.  Treasury yields are stuck near the bottom of historical rates; 3-month notes yielded 0.26% at the end of the quarter, while 12-month bonds were yielding just 0.43%.  Go out to ten years, and you can get a 1.47% annual coupon yield.  Low?  Compared with rates abroad, these yields are positively generous.  If you’re buying the German Bund 10-year government securities, you’re receiving a guaranteed -0.13% yield (yes, that's a negative yield).  The 5-year yield is actually worse: -0.57%.  Japanese government bonds are also yielding -0.3% (2-year) to -0.23% (10-year). Can you imagine paying someone to hold your money for you?

On the first day of July, the Dow, S&P 500 and Nasdaq indices were all higher than they were before the Brexit vote took investors by surprise, which suggests that, yet again, the people who let panic make their decisions, lost money while those who kept their heads in it, sailed through.  There will be plenty of other opportunities for panic in a future where terrorism, a continuing mess in the Middle East, a refugee crisis in Europe and premature announcements of the demise of the European Union will deflect attention away from what is actually a decent economic story in the U.S.

How decent?  The American economy is on track to grow at a 2.0% rate this year, which is hardly dramatic, but it is sustainable and not likely to overheat different sectors and lead to a recession.  Manufacturing activity is expected to grow 2.6% for the year based on the numbers so far, and the unemployment rate has fallen to 4.7%, which is actually below the Federal Reserve target.  Inflation is also low: running around 1.4% this year.  The unemployment statistics are almost certainly misleading in the sense that many people are underemployed, and a sizable number of working-age men are no longer participating in the labor force, but for many Americans, there’s work if you want it.  Historically low oil prices and high domestic production have lowered the cost of doing business and the cost of living across the American economic landscape.

Despite all this good news, the market is struggling to keep its head above water this year, and is not threatening the record highs set in May of last year. But we're close, and I suspect that we will challenge and rally above the old highs soon.

Questions remain.  The biggest one in many peoples’ minds is: WILL the European Union break up now that its second-largest economy has voted to exit?  There is already renewed talk of a Grexit, along with clever names like the dePartugal, the Czechout, the Big Finnish and even discussion about Texas (Texit?) leaving the U.S.  How long before we hear about (cue the sarcasm) some localities declaring independence from their states?  With active political movements in at least a dozen Eurozone countries agitating for an exit, is it possible that someday we’ll view the UK as the first domino?

A recent report by Thomas Friedman of Geopolitical Futures suggests that the EU, at the very least, is going to have to reform itself, and the vote in Britain could be the wake-up call it needs to make structural changes.  The Eurozone has been struggling economically since the common currency was adopted.  It is still dealing with the Greek sovereign debt crisis, a potential banking crisis in Italy, economic troubles in Finland, political issues in Poland and, in general, a huge wealth disparity between its northern and southern members.  Is it possible that a flood of regulations coming out of Brussels is imposing an added burden on European economies?  Should different nations be allowed to manage their policies and economies with greater independence and focus?

Friedman thinks the UK will be just fine, because Europe needs it to be a strong trading partner.  Britain is Germany’s third-largest export market and France’s fifth largest.  Would it be wise for those countries to stop selling to Britain or impose tariffs on British exports?  And more broadly, with the political turmoil in the UK, is it possible that there will be a re-vote, particularly if the European Union decides to make reforms that result in a less-stifling regulatory regime?

You’ll continue to see dire headlines, if not about Brexit or the Middle East, then about China’s debt situation and the Fed either deciding or not deciding to raise rates in the U.S. economy (it won't).  Oil prices are going to bounce around unpredictably.  The remarkable thing to notice is that with all the wild headlines we’ve experienced so far, plus the worst start to the year in U.S. market history, the markets are up slightly here in the U.S., and the economy is still growing.  The chances of a U.S. recession starting in the next nine months are 10% or less.  Yes, your international investments are down right now, but eventually, you can expect them to come to the rescue when the American bull market finally turns.

When will that be?  If we knew how to see the future for certain, we would be in a different business.  All of us are going to have to resign ourselves to being surprised by whatever the rest of the year brings us, headline by headline. That, however, doesn't stop me from making my own prognostication about what the market might bring.  By the end of the year, I think we'll see mid-single digit gains for the year, after some hand-wringing over the election, in what I expect to be a rough September and October in the markets. But then again, I thought the Brexit would be voted down, so don't bet your chips on any predictions anyone has, including me. This keeps us mostly invested with good hedges to absorb whatever volatility the market throws at us.

Sources:

Wilshire index data.  http://www.wilshire.com/Indexes/calculator/

Russell index data: http://indexcalculator.russell.com/

S&P index data: http://www.standardandpoors.com/indices/sp-500/en/us/?indexId=spusa-500-usduf--p-us-l--

Nasdaq index data: http://quicktake.morningstar.com/Index/IndexCharts.aspx?Symbol=COMP

International indices: http://www.mscibarra.com/products/indices/international_equity_indices/performance.html

Commodities index data: http://us.spindices.com/index-family/commodities/sp-gsci

Treasury market rates: http://www.bloomberg.com/markets/rates-bonds/government-bonds/us/

Aggregate corporate bond rates: https://indices.barcap.com/show?url=Benchmark_Indices/Aggregate/Bond_Indices

Aggregate corporate bond rates: http://www.bloomberg.com/markets/rates-bonds/corporate-bonds/

http://useconomy.about.com/od/criticalssues/a/US-Economic-Outlook.htm

http://www.marketwatch.com/story/first-quarter-us-gdp-raised-to-11-2016-06-28?siteid=bulletrss

The MoneyGeek thanks guest writer Bob Veres for his contribution to this post